

In 2024, restaurant technology truly entered the chat. For years, tech has been helping restaurants operate efficiently and drive revenue. But since the pandemic, technology has become central to the connection between restaurants and diners. This year, the tech conversation became the restaurant conversation. Based on data from thousands of restaurants across the country, read on to see the stories that defined the restaurant industry in 2024.
Small Bites
Fun facts for your next restaurant technology-based dinner conversation.


Technology
Three stories about technology’s power to build (or block) the connection between restaurants and diners.
E-commerce
“We produce a lot of our retail products out of the same kitchen the guests receive their food from every night. It’s about extending our restaurant’s experience to people’s homes.”
Eliza Christen | Director of Operations, Grovehouse Hospitality
Third-Party Ordering
“These are big tech companies that feed on data. I’m a small business, but I can use that data in a way where it improves the customer experience.”
David Edelman | Owner, Dado’s Pizza & Taproom
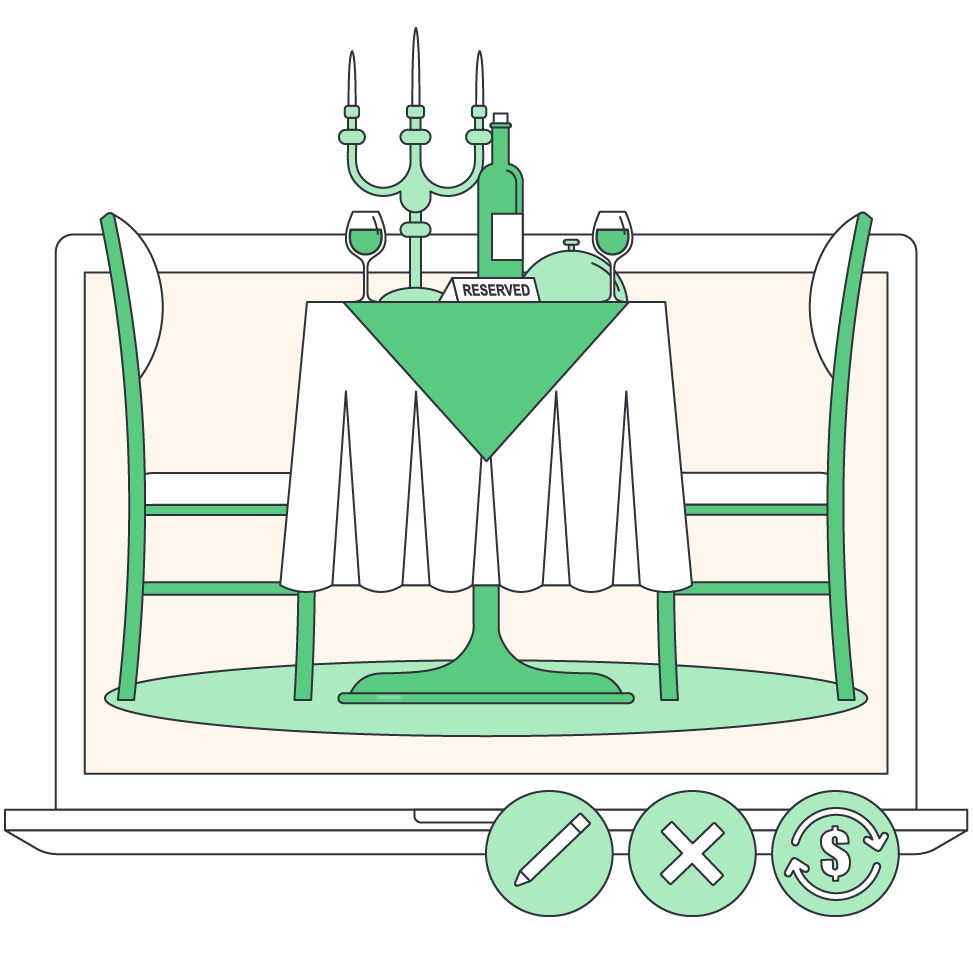
Reservation Trading
Eighty percent of Appointment Trader’s 100 most popular restaurants manage reservations with third-party services.
E-commerce
“We produce a lot of our retail products out of the same kitchen the guests receive their food from every night. It’s about extending our restaurant’s experience to people’s homes.”
Eliza Christen | Director of Operations, Grovehouse Hospitality
Third-Party Ordering
“These are big tech companies that feed on data. I’m a small business, but I can use that data in a way where it improves the customer experience.”
David Edelman | Owner, Dado’s Pizza & Taproom
Operations
A data-driven look at the U.S. restaurant industry this year.
Labor: Changes ahead
In 2024, a flurry of restaurant labor laws changed across the country. California raised its minimum wage for fast food workers to $20/hr. A number of states and cities revised employee age requirements. At the federal level, two Biden-era rules were overturned: the redefinition of “joint employment” and the 80/20 rule. Even the presidential candidates waded into restaurant labor, promising “no taxes on tips.” It’s been a wild ride.
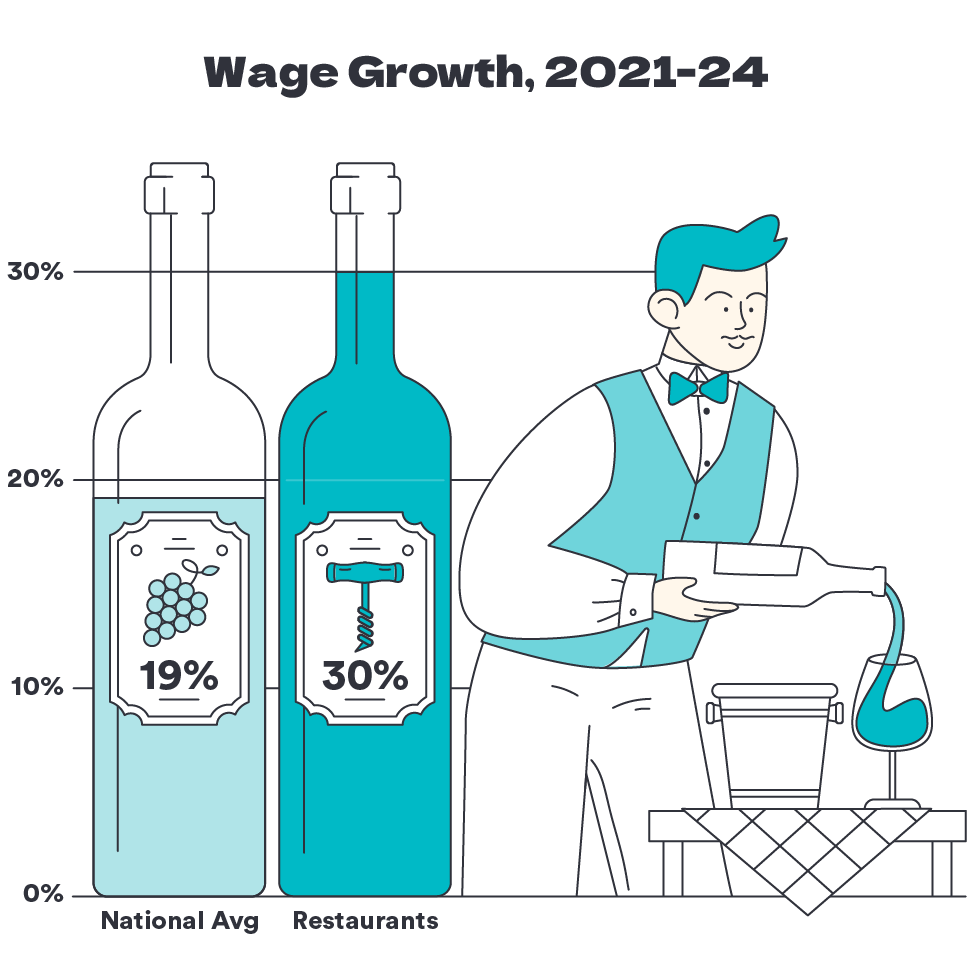
For restaurants, the legal and political changes added to a dizzying few years of labor turmoil. Between 2021 and 2024, restaurant wages soared by 30%, two-thirds more than the national average. Turnover since the pandemic has been the highest on record, with restaurant employees quitting 24% more frequently since 2021 than they did before COVID.
Even though costs and turnover are coming back to earth entering 2025, frenetic regulatory changes made 2024 a deeply confusing time to manage employees in a restaurant. No wonder technology is finding its way into more and more aspects of restaurant operations.
From 2015 to 2019, an average of 4.2% of the national hospitality workforce quit every month. From 2021 through 2023, that rate jumped by almost a quarter to 5.2%.
Revenue: Another growth year
Restaurant revenues remained solid in 2024, with diners spending about 5% more in U.S. restaurants than they did in 2023. It was a touch less than last year’s growth of 7%, but good news: More than half of this year’s revenue growth came from higher transaction volume — restaurants doing more business — versus simply adjusting to higher prices.
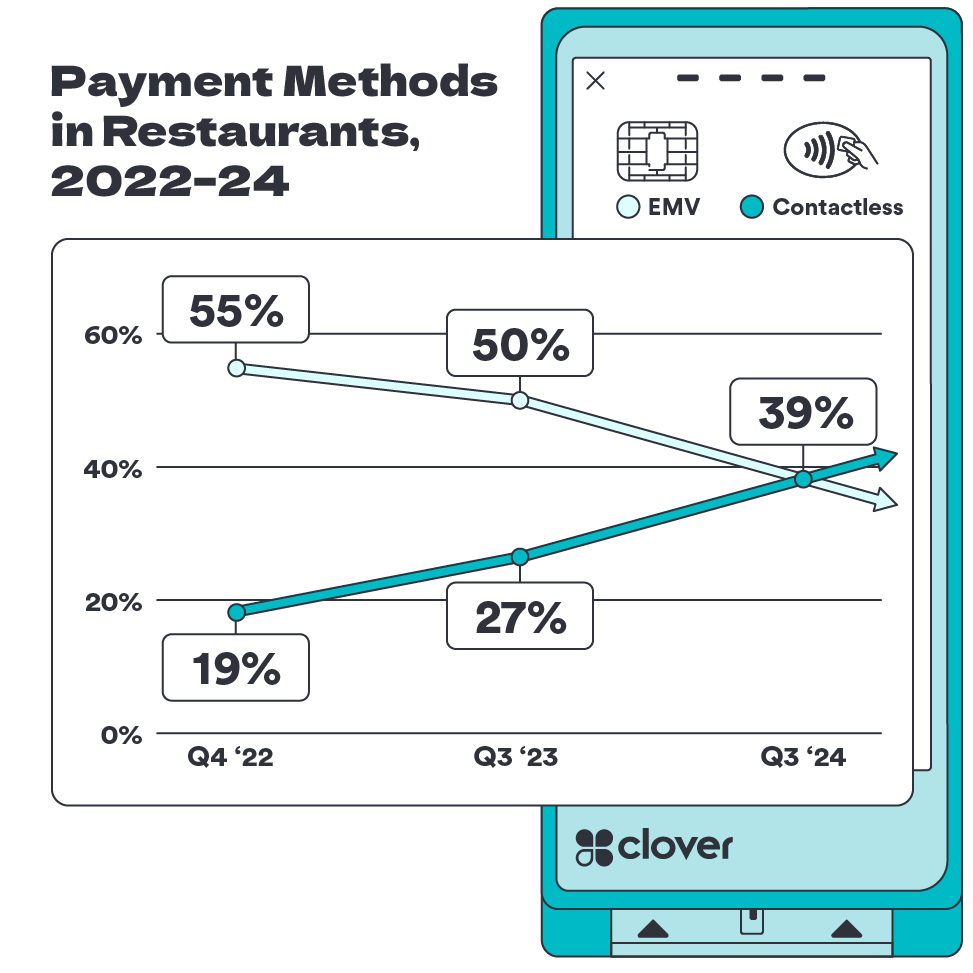
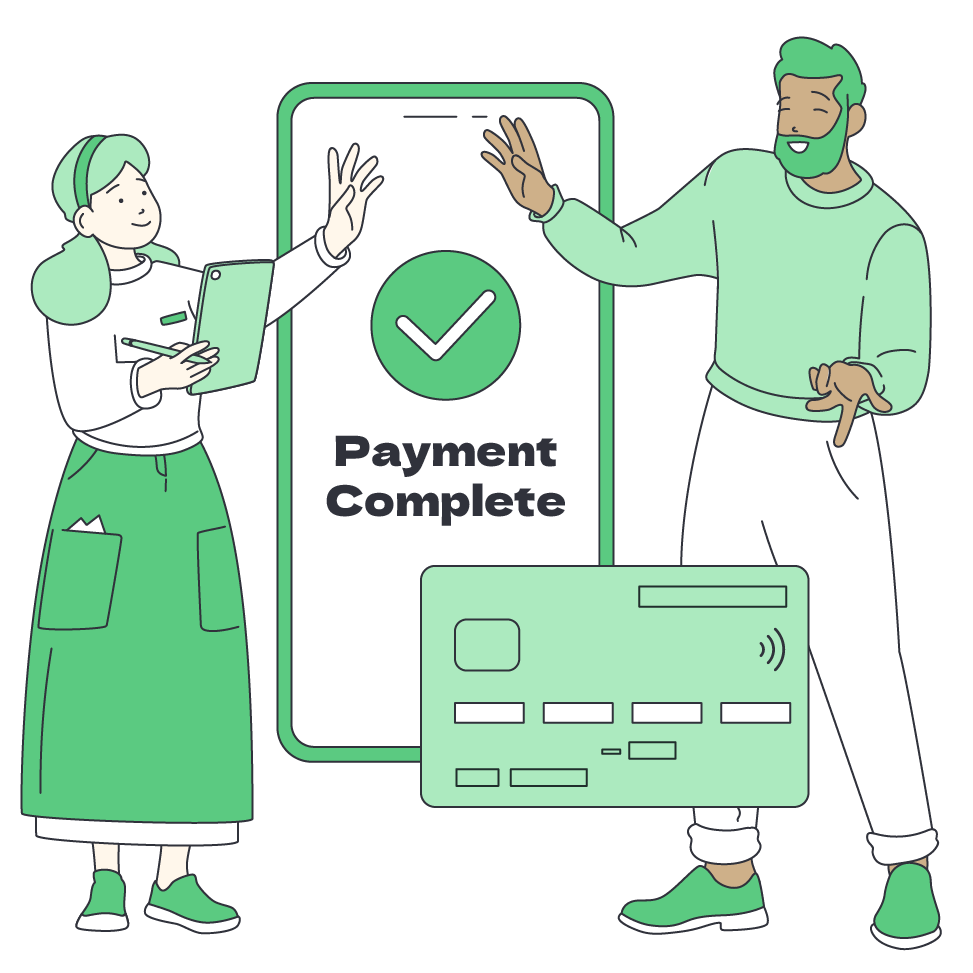
Underneath that steady growth, an interesting trend has been emerging around payments. For the last two years, restaurant customers have been dipping card chips less and using contactless “tap-to-pay” more. Fall 2024, in fact, was when the two technologies converged. Each now makes up 39% of all in-person card transactions.
But it’s clear contactless payments are taking over. Mobile payments have doubled since 2022, now making up 14% of in-person card transactions. These trends suggest a growing customer preference for tableside POS devices that give diners the flexibility to pay with a card or a phone.
In 2024, restaurant transaction count grew by 2.7% and average ticket amount by 2.2%, totaling an annual revenue increase of 4.9%.
Inflation: Breathing room in sight
While costs continued to rise in 2024, data suggests that restaurant prices have finally caught up.
In 2024, consumer costs rose by just over 2%. It was a far cry from what we saw a few years ago, when inflation briefly topped 9%. But cooling inflation is only half the story. For restaurants, post-pandemic inflation splits into two periods: the first two years, when restaurant menu prices failed to keep up with cost increases, and the last two years, when menu price increases have well exceeded inflation.
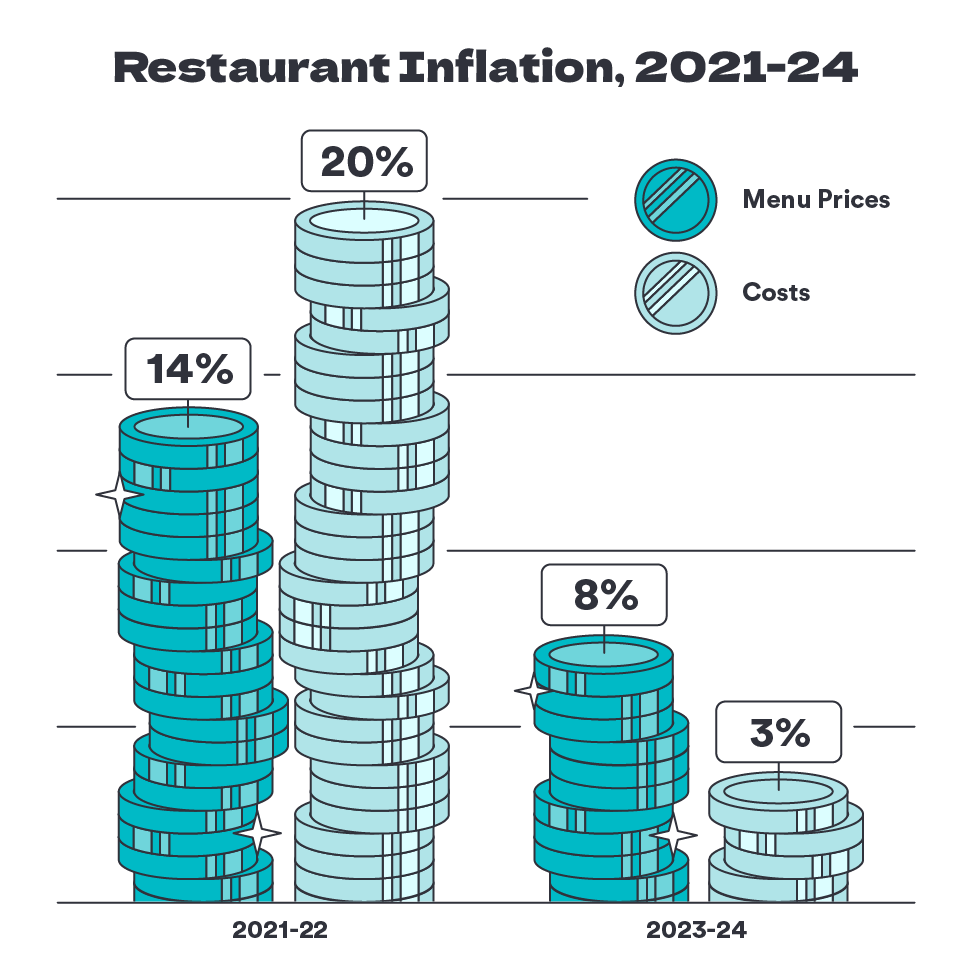
Since 2023, food retailers’ overall cost of doing business has increased by 3%. But restaurant prices rose more than twice as much. If this sounds strange, it’s probably because the two years before that were historically brutal. Between 2021 and 2022, costs rose 20% — by far the sharpest increase on record — while menu prices lagged, rising “only” 14%.
Chasing that lost margin, restaurants spent 2023 and 2024 hiking prices. The result is that entering 2025, the last four years have seen restaurant costs increase by an absurd 26% and prices by 24%.
The good news is that breathing room is in sight for restaurants. High inflation should be behind us, bringing more stable operations and less sticker shock for diners. Fingers crossed.
In 2022–23, annualized cost inflation for food & beverage retailers exceeded 10% for thirteen straight months.
Labor: Changes ahead
In 2024, a flurry of restaurant labor laws changed across the country. California raised its minimum wage for fast food workers to $20/hr. A number of states and cities revised employee age requirements. At the federal level, two Biden-era rules were overturned: the redefinition of “joint employment” and the 80/20 rule. Even the presidential candidates waded into restaurant labor, promising “no taxes on tips.” It’s been a wild ride.
For restaurants, the legal and political changes added to a dizzying few years of labor turmoil. Between 2021 and 2024, restaurant wages soared by 30%, two-thirds more than the national average. Turnover since the pandemic has been the highest on record, with restaurant employees quitting 24% more frequently since 2021 than they did before COVID.
Even though costs and turnover are coming back to earth entering 2025, frenetic regulatory changes made 2024 a deeply confusing time to manage employees in a restaurant. No wonder technology is finding its way into more and more aspects of restaurant operations.
From 2015 to 2019, an average of 4.2% of the national hospitality workforce quit every month. From 2021 through 2023, that rate jumped by almost a quarter to 5.2%.
Revenue: Another growth year
Restaurant revenues remained solid in 2024, with diners spending about 5% more in U.S. restaurants than they did in 2023. It was a touch less than last year’s growth of 7%, but good news: More than half of this year’s revenue growth came from higher transaction volume — restaurants doing more business — versus simply adjusting to higher prices.
Underneath that steady growth, an interesting trend has been emerging around payments. For the last two years, restaurant customers have been dipping card chips less and using contactless “tap-to-pay” more. Fall 2024, in fact, was when the two technologies converged. Each now makes up 39% of all in-person card transactions.
But it’s clear contactless payments are taking over. Mobile payments have doubled since 2022, now making up 14% of in-person card transactions. These trends suggest a growing customer preference for tableside POS devices that give diners the flexibility to pay with a card or a phone.
In 2024, restaurant transaction count grew by 2.7% and average ticket amount by 2.2%, totaling an annual revenue increase of 4.9%.
Web Design
Members of the BentoBox Web Design team on the trends they’ve seen in 2024.
Bold Statement Headers
This eye-catching style emphasizes large, striking typography that immediately conveys the essence of a brand or message. These attention-grabbing elements set the tone for the overall experience by incorporating vivid colors and unique fonts. Together, these elements create a memorable first impression, making content more approachable and inviting.
Statement headers also support a more streamlined design aesthetic. By prioritizing impactful text, designers can minimize clutter and focus users’ attention on essential elements. Lulla’s website demonstrates this style, using large headers and simple line art illustrations to guide users while ensuring that the website remains visually appealing and easy to navigate.
– Lindsey Robinson, Web Designer

Micro Animations
In recent months we’ve seen an increase in requests for micro animations: small-scale animations that encourage interaction and add character to the site. Animation is trendy every year, but accessibility standards often render more complex animations fallible. Micro animations pack a similar punch while carrying a much lower risk. They can be applied to button hovers, graphic elements, page load-ins — any component you want to spotlight.
We were able to implement this style in our site design for Taco Boy by placing their sunburst icon on either side of the headings and animating them to rotate. This was a playful way of emphasizing text hierarchy without overwhelming users.
– James Coviello, Senior Designer II

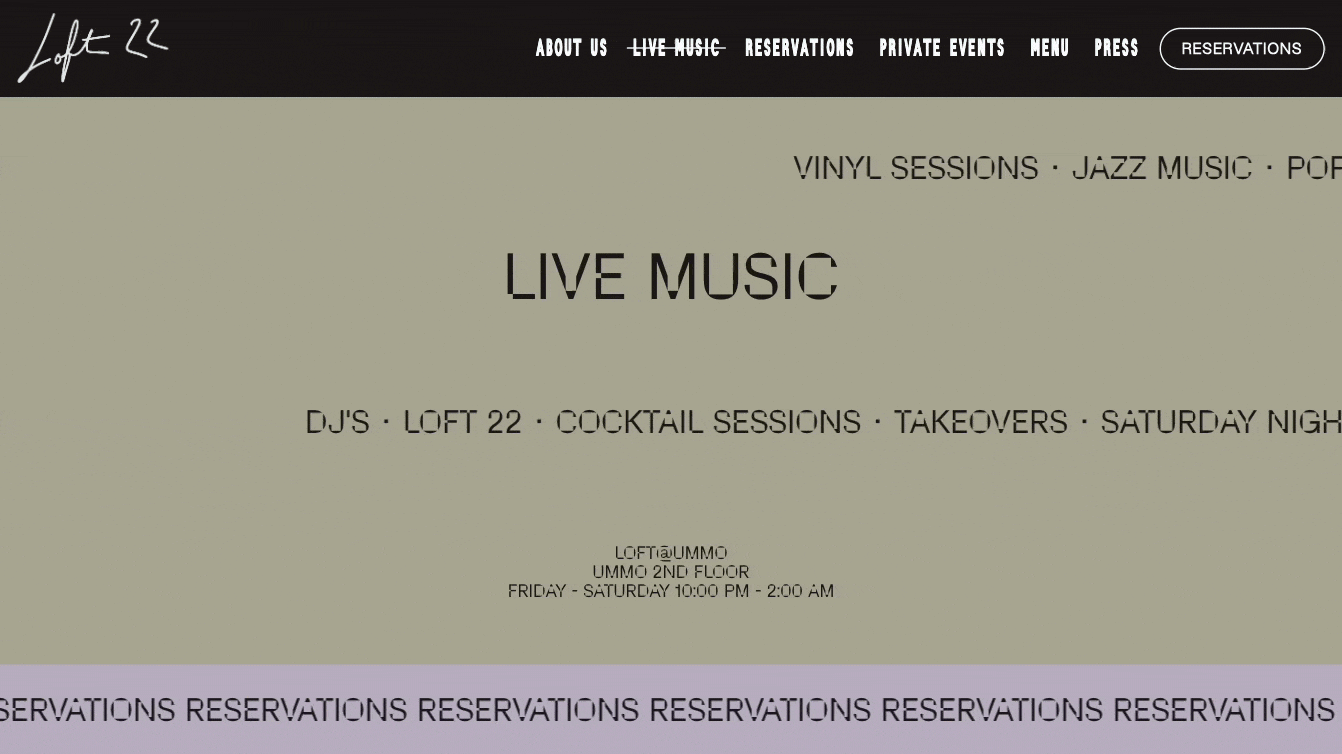
Scrolling Marquees
This style, in which words and images move across the screen, brings a lively, retro-inspired feel to modern sites, making them more engaging but not too busy. As brands try to stand out, the scrolling marquee provides a fresh way to catch people’s attention, offering a break from the usual static images and sliders. Its charm lies in blending a touch of nostalgia with a new way to showcase key content.
On Loft 22’s website, the scrolling marquee draws attention to key details about event spaces, offerings, and brand values. This bold, moving text creates a lively first impression, keeping essential information front and center.
– Christopher Nervegna, Senior Designer
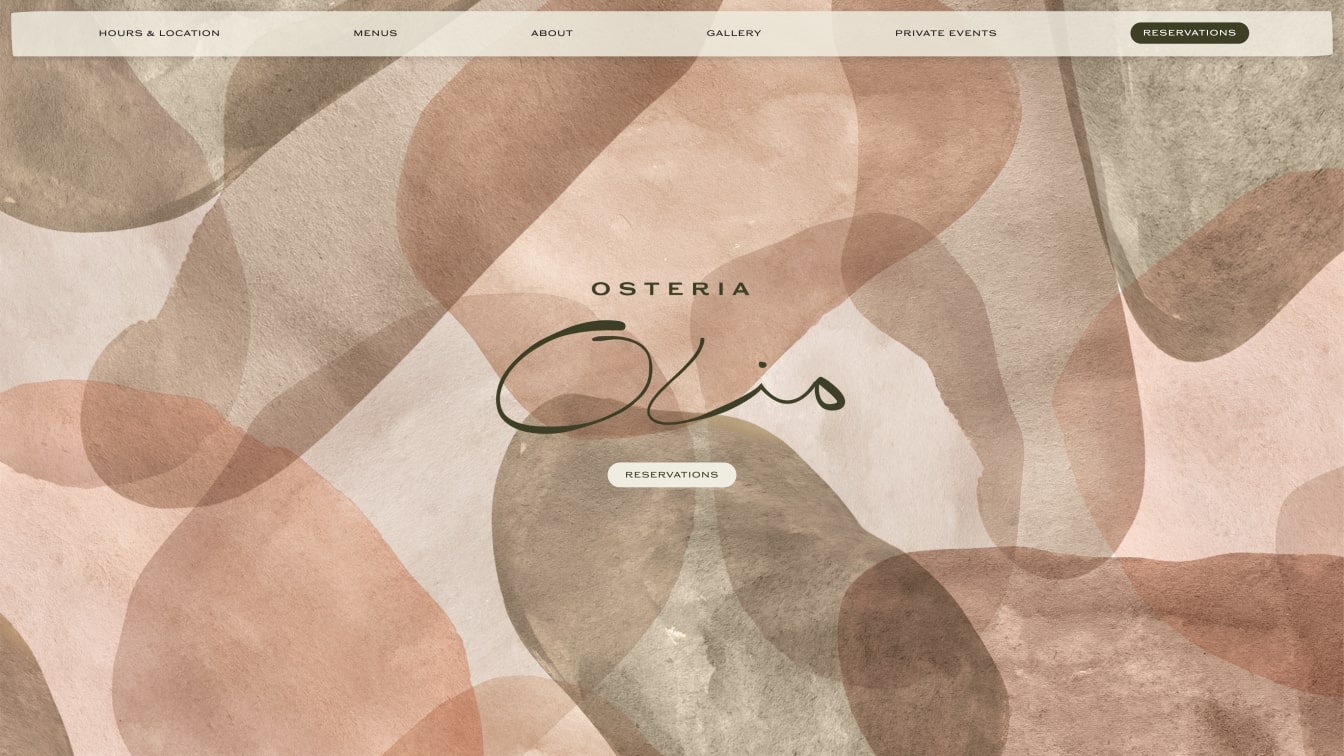
Organic Shapes & Textures
Moving away from sharp, minimalist lines and polished symmetry, this style introduces hand-drawn forms, soft edges, and natural textures to give websites a human touch. It’s likely a response to the flat, hyper-digital designs of recent years, and reflects a collective craving for authenticity and individuality. In a world of grid-based layouts, these organic elements feel inviting and genuine — qualities that resonate deeply with restaurants.
On Osteria Olio’s website, textured backgrounds and fluid shapes echo the restaurant’s warmth and emphasis on artisanal craftsmanship, showing how a human touch can make digital interactions genuine and memorable.
– Kayla Scheidel, Senior Manager of Web Design
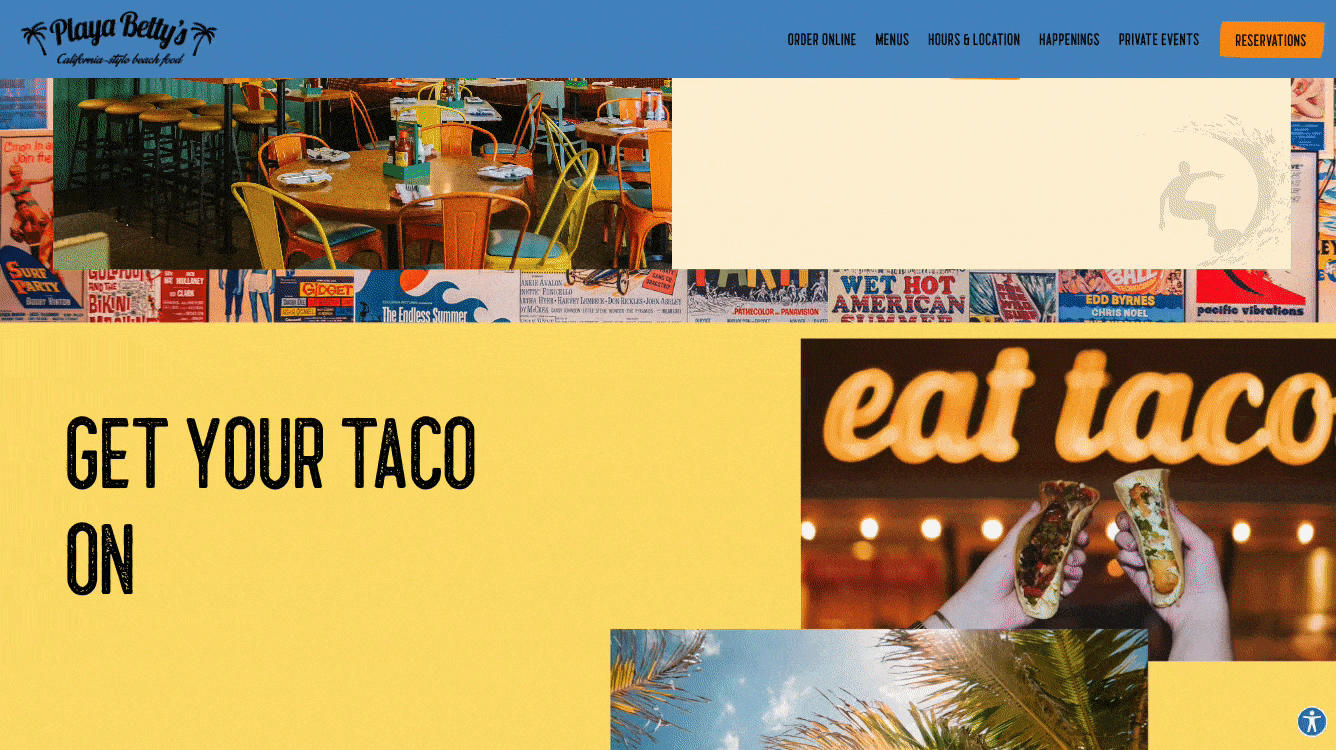
Fixed Content on Scroll
Playing off the parallax trend that has maintained popularity for years, this style creates a sense of depth by fixing certain elements or sections while allowing others to scroll freely. This scroll-within-a-scroll effect is more subtle and easier to navigate than other non-traditional scrolling effects, such as the horizontal scroll that was popular in previous years. It also offers some variety in the application, as it can be used on a whole section or on individual elements within a section.
Playa Betty’s website is a great example. The user experiences a normal scroll until hitting the stacked images, at which point the text becomes “sticky.” The interaction immediately upgrades the section from feeling like a simple layout.
– Chelsea Davis, Web Designer
Bold Statement Headers
This eye-catching style emphasizes large, striking typography that immediately conveys the essence of a brand or message. These attention-grabbing elements set the tone for the overall experience by incorporating vivid colors and unique fonts. Together, these elements create a memorable first impression, making content more approachable and inviting.
Statement headers also support a more streamlined design aesthetic. By prioritizing impactful text, designers can minimize clutter and focus users’ attention on essential elements. Lulla’s website demonstrates this style, using large headers and simple line art illustrations to guide users while ensuring that the website remains visually appealing and easy to navigate.
– Lindsey Robinson, Web Designer
Micro Animations
In recent months we’ve seen an increase in requests for micro animations: small-scale animations that encourage interaction and add character to the site. Animation is trendy every year, but accessibility standards often render more complex animations fallible. Micro animations pack a similar punch while carrying a much lower risk. They can be applied to button hovers, graphic elements, page load-ins — any component you want to spotlight.
We were able to implement this style in our site design for Taco Boy by placing their sunburst icon on either side of the headings and animating them to rotate. This was a playful way of emphasizing text hierarchy without overwhelming users.
– James Coviello, Senior Designer II
Predictions
Looking ahead to the stories we'll be talking about in 2025.
You’ll see restaurant celebrities doing actual work.

Mobile apps will give way to loyalty programs.
The tip credit conversation will be rooted in real data.
Restaurants will get in on reservation trading.
You’ll dine and dash.
You’ll see restaurant celebrities doing actual work.
Mobile apps will give way to loyalty programs.
1. All “Small Bites” based on BentoBox product data. In this report, “2024” refers to the 12-month period ending September 30, 2024. 2. Reservation channel analysis performed by BentoBox on the 100 most popular restaurants on AppointmentTrader.com. 3. E-commerce revenue via BentoBox, search interest via Google Trends. 4. Spending data in this section is Fiserv proprietary data and includes only actual card-based forms of payment. SpendTrend® from Fiserv is a macro-economic indicator that reports aggregated year-over-year same store sales activity for card-based payments. SpendTrend does not represent Fiserv financial performance. 5. BLS, Consumer Price Index for Urban Consumers (CPIAUCSL) 6. BLS, Producer Price Index for Food & Beverage Retail (PCU445445) 7. BLS, Consumer Price Index for All Urban Consumers: Food Away from Home in U.S. City Average (CUSR0000SEFV) 8. BLS, QCEW of “Restaurants and other eating places, National” (NAICS 7225) and “Private, all industries, National” 9. BLS, Quits: Leisure & Hospitality (JTS7000QUR)