
Operations
6 Key Restaurant Metrics to Track to Stay Profitable
These are the metrics you should be tracking regularly.
Businesses rely on data to survive. This is especially true for restaurants, where metrics help operators track operating costs and profit margins. Here are the numbers that business owners should constantly keep track of as well as ones to monitor monthly.

PRODUCT
Restaurant Dashboard
Control your content and manage your restaurant's success with an easy-to-use dashboard.
3 Metrics Keeping Operators Up at Night
When it comes to making revenue, keeping the doors open and retaining your employees, there are three metrics that matter most.
COGS: Cost of Goods Sold
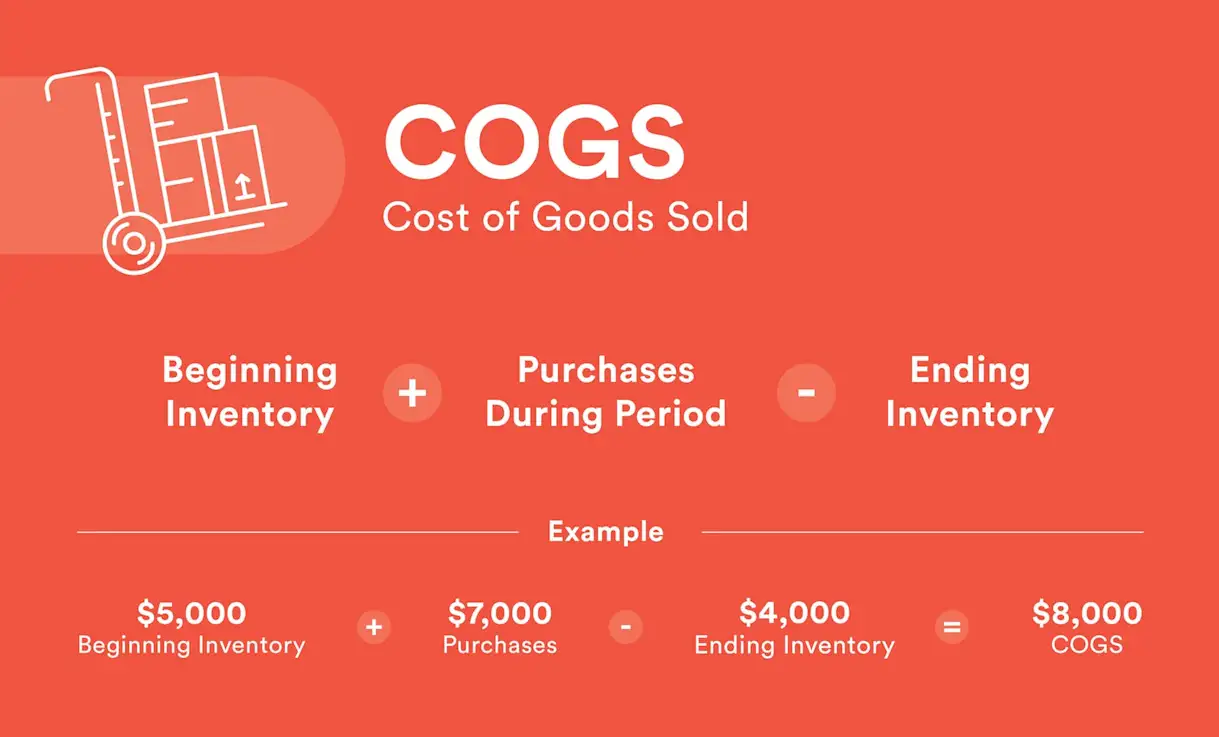
This metric tells you how much it costs to sell your inventory in a time period. The lower your COGS, the better. To reduce this number, operators can use tactics like buying in bulk, finding suppliers with cheaper costs, and closely monitoring inventory numbers.
Overhead Rate
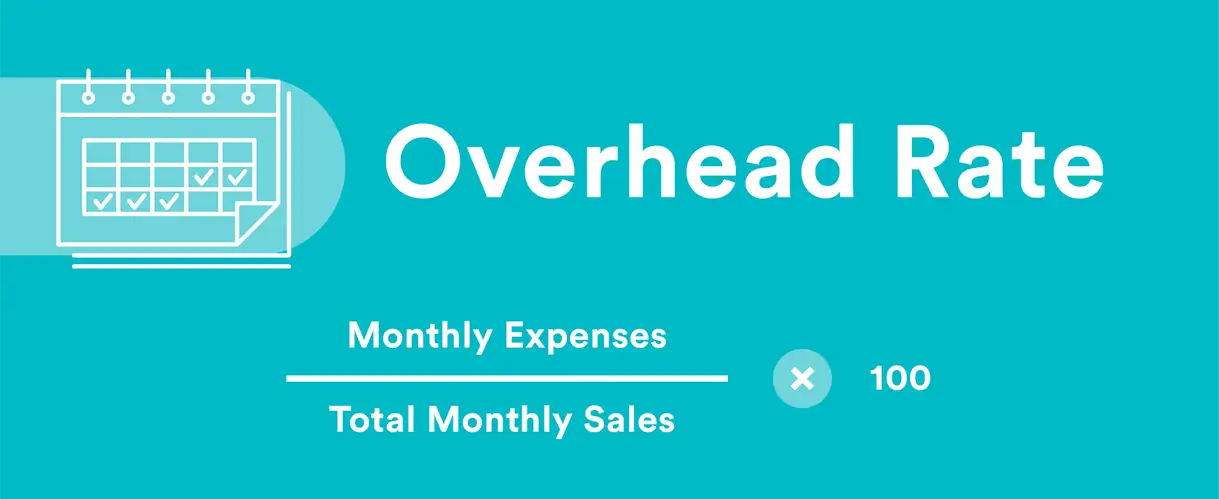
This tells you how much of your revenue is generally being used to operate your restaurant. Expenses include rent, taxes, salaries, equipment, utilities, repairs or maintenance, and advertising/marketing. However, it does not include anything related to producing food. The best way to decrease your overhead rate is to lower your total monthly expenses. This could mean replacing paid advertising campaigns with free alternatives like posting on social media, finding discounted new equipment, or cutting utility bills by being more efficient with electricity.
Employee Turnover Rate
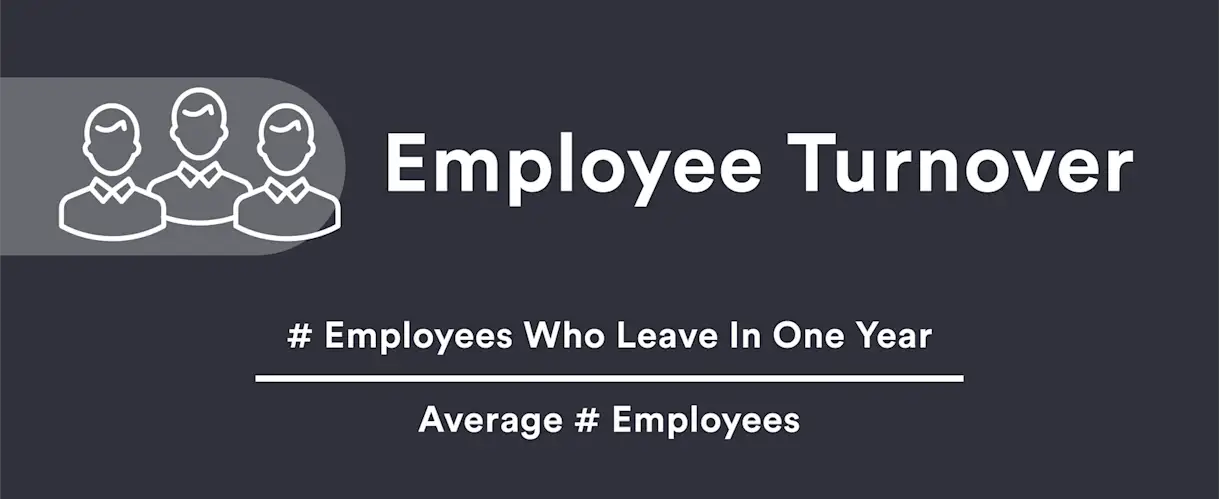
This tells you the percentage of your employees who have left their positions. A lower effort way to reduce your employee turnover rate is to survey your employees and ask them how you can improve. Higher effort projects could include revamping new employee training, developing growth tracks for seasoned staff, refining your hiring process and beginning a recognition program to reward employees for good performance.
While these are common metrics that restaurant owners and operators pay close attention to, particularly in the brick and mortar, there are metrics in the digital space that should be watched as well.
PRODUCT
Turn Your Website Into a Revenue Generator
Create your digital storefront for online ordering, catering, gift cards, merchandise, events and more.
3 Numbers You Should Be Monitoring Monthly
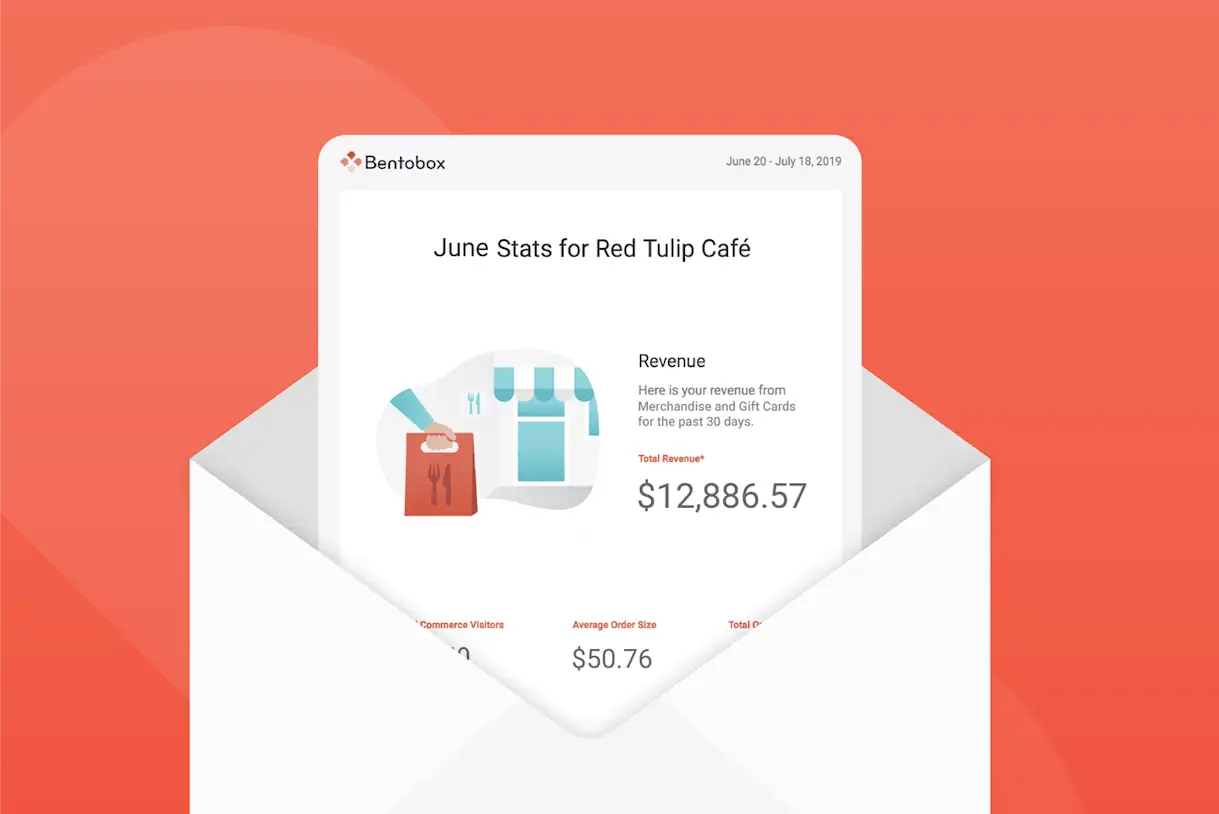
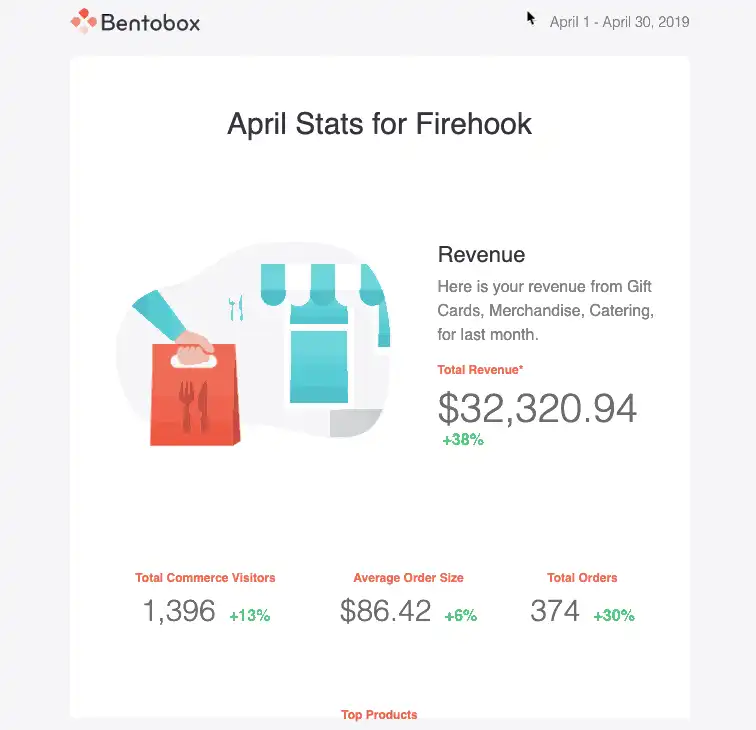
While most restaurants regularly report on the metrics above, the three metrics below are also important to monitor. That’s why BentoBox tracks these numbers for customers and sends them in a monthly performance digest. Our users receive an Insights Email on the first day of every month, showing them their eCommerce revenue and website stats from the prior month. This helps restaurants like you to better understand your business in seconds. Read on to see the metrics included in the email.
Top Pages Visited On Your Website
As a restaurant operator, you want to know what your customers are doing on your website. The best way to see this is to look at visits to your website pages. This shows you the visitor’s intent. Where are they going after your homepage? Are they looking at your menu? Your location?
Here is an example of the BentoBox backend dashboard that shows a breakdown of traffic for the top pages on a customer’s site:
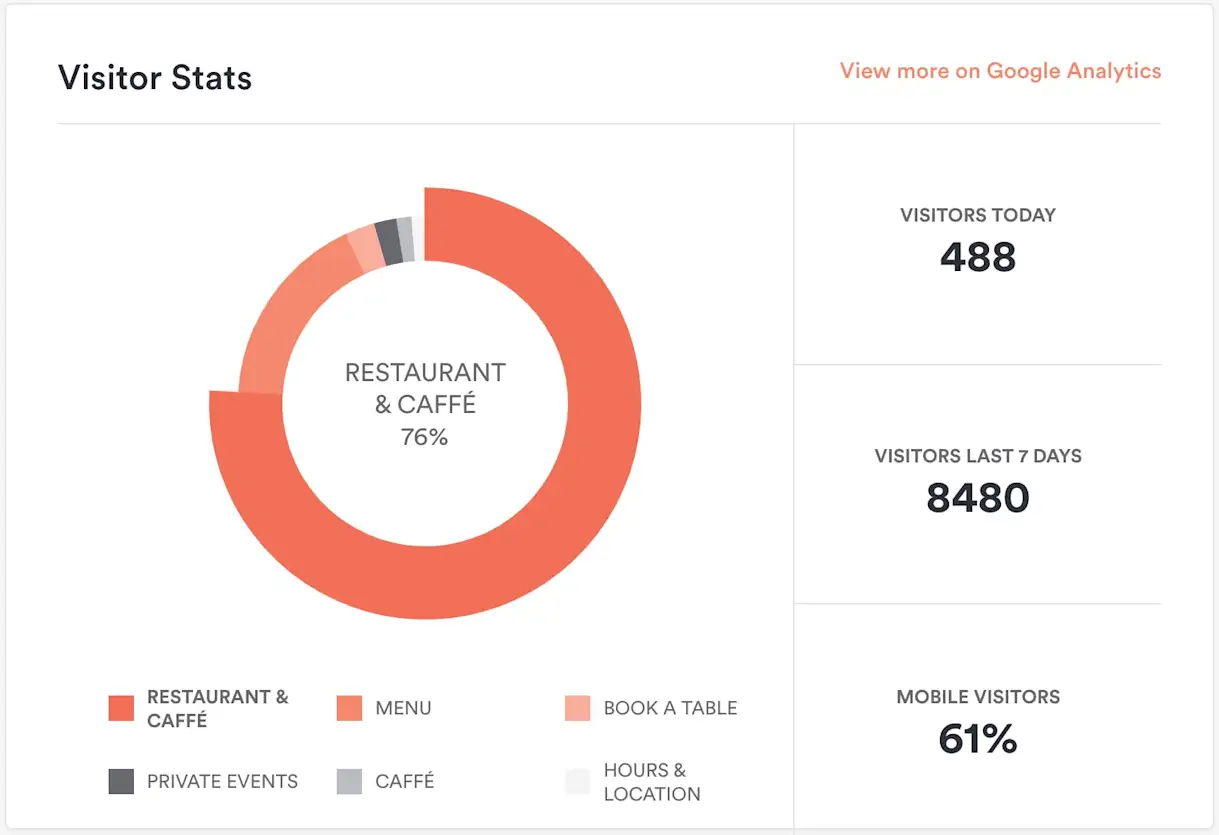
In the example above, most website visitors are viewing the homepage and menu. If you want to drive website traffic to other pages that might be going unnoticed, you could set an overlay alert on your homepage with benefit language, linking to that page.
eCommerce Revenue
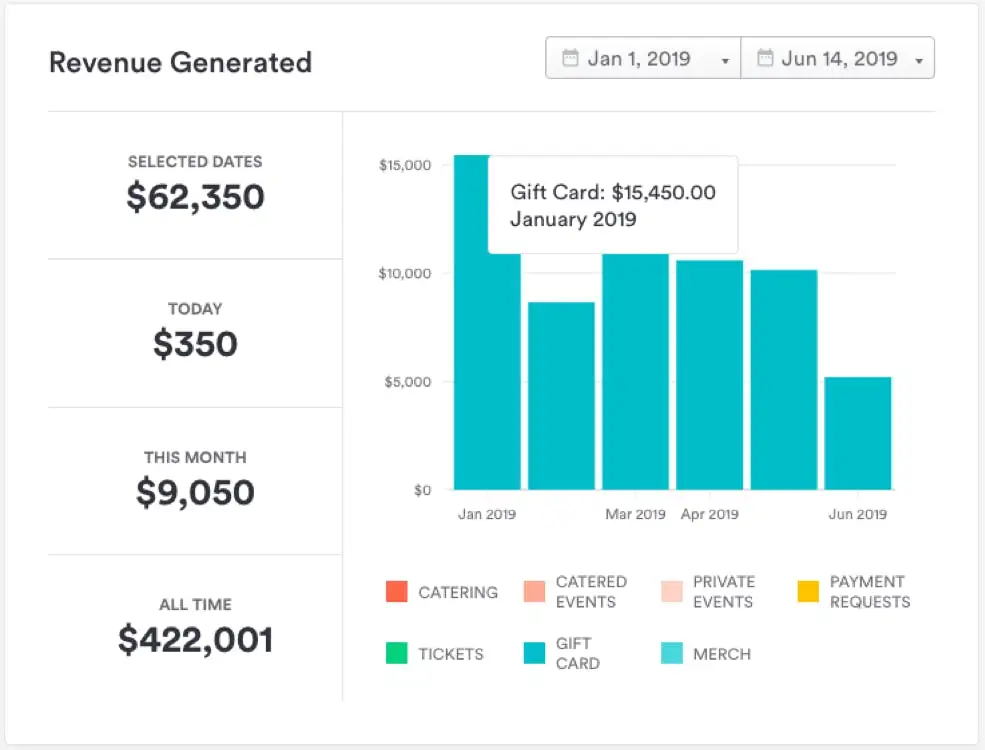
If you’re selling anything on your website, you should be keeping track of your sales over time. This is an easy way to see what’s working well for your restaurant and what offers guests might not be interested in or aware of.
Let’s say you sell plenty of t-shirts at your restaurant, but sales online are low. In this case, you know t-shirts are popular. People just aren’t seeing or buying them on your website. As a solution, you could send an email marketing campaign to your guest database to spread the word about the convenience of completing this transaction online.
Number of Interactions
If your phone number and address are clickable by guests on your website, you should keep track of how engagement changes over time. How many guests click for Google Maps directions? What about to call you? How many are submitting forms? Or making reservations?
BentoBox customers can easily see these metrics in their monthly report and therefore know exactly how their website is performing. If you see that your number of Google Map clicks each month is high, this justifies putting time and attention into updating your Google Business Profile listing (something you can do automatically).
Interested in how your restaurant can easily access website analytics and revenue data? Schedule your demo of BentoBox today.
BentoBox Marketing & Commerce Platform
Want to stand out online? Let's chat.
Drive revenue directly through your website.
Recommended

Commerce
How to Use Ecommerce to Boost Your Restaurant's Sales
June 24, 2020
Why restaurants should offer gift cards, merchandise and more online.

Operations
Key Restaurant Benchmarks: Average Profit Margin, Prime Cost & More
April 6, 2022
To measure success, your restaurant needs clearly defined goals. These benchmarks for key metrics can guide the way.

Operations
How To Run a Profitable Restaurant
January 27, 2022
To run a profitable business, restaurants need to calculate their profit margin and know how to improve it.